
How often does an AI assistant recommend a specific product when someone is ready to buy? A field report by Alexander Holl and Dr. Christoph Röck on our measurement approach in 121suite – and its limits.
Du kannst dir 121WATT-Inhalte in der Google-Suche jetzt bevorzugt anzeigen lassen.
Does visibility in AI assistants actually drive business? The industry is divided on this question. Studies focusing on clicks suggest the impact is minimal. We believe clicks are the wrong yardstick – but we don’t want to rely on assumptions either.
That is why we use 121suite to measure how often an AI assistant recommends a specific product when someone asks for a solution. Instead of simply counting brand mentions in individual answers, we simulate multi-step buying conversations. This gives us comparable signals on who makes the shortlist, who becomes the favourite and which criteria tip the balance.
It remains a measurement of synthetic conversations – not a picture of real buyers. And a higher recommendation rate is not yet proof of revenue. That is why we check the business effect separately, by asking customers. Below we show how we work, what we deliberately left out and where the limits are.
Measuring visibility in AI systems is just as contested as GEO itself. In October 2026, Rand Fishkin summarised three studies that take a sceptical view of the business impact of AI visibility outside Google Search:
Fishkin himself draws a clear line: Google’s own AI (AI Overviews, AI Mode, Gemini) does matter. The opposing view is held by Michael King (“AI search is a branding channel”) and Christian Kunz, among others: a channel designed to make clicks unnecessary should not be judged by its clicks.
Fishkin’s whiteboard in detail. In his #5minutewhiteboard, Fishkin asks pointedly whether AI visibility is a boondoggle, a sham or a distraction. After reading the three studies, he says he is less confident than ever that more visibility in ChatGPT, Claude, Perplexity or Copilot brings much business for most companies. In the discussion he adds that, in clickstream data he is currently analysing, AI visibility correlates with sales far less than other channels do, with rare exceptions.
He puts three questions to the market:
These questions are fair. For an individual company, though, the decisive question may not be how many questions are asked about its product – but whether its product is recommended when the question is asked. How important AI assistants have become, anyone can see in their own behaviour and in publicly available user numbers. That is why we developed an approach that lets us say how reliable a visibility measurement of AI product recommendations is. We see the measurement not as proof of business but as a diagnosis: who is recommended instead of us, by which criterion and based on which sources?
We check the business effect separately: we don’t ask in general about the “most important source of information”, but – right after a purchase – about what triggered that specific purchase, with randomised answer order and a dummy option. Biases remain all the same. That is why we read trends over time there, not absolute shares.
We believe both perspectives capture something important. Click studies measure demonstrable visitor flows. Our measurement checks whether an offer is recommended in a simulated selection process. Neither alone answers the question of the actual contribution to revenue.
| Critical objection | Our answer | What remains open |
|---|---|---|
| “AI brings hardly any traffic.” | We measure the recommendation before a possible click. | Whether it leads to additional revenue – for that, we ask customers. |
| “Synthetic prompts are not buyers.” | Multi-step dialogues, checked prompts, repetitions, web search in the target market. | Real questions, personalisation and user context. |
| “Google matters more.” | Gemini is one of the four assistants we measure. | We do not measure AI Overviews and AI Mode directly. |
| “GEO tricks only work short-term.” | We show criteria and sources, i.e. starting points for brand and PR work. | The effect and durability of individual measures. |
| “A single global number hides lost markets.” | We measure per market, in its language and with its web search. | – |
In classic Google Search we know rankings: for a keyword, a page holds a certain position. It can change, but it is basically observable. ChatGPT and other AI assistants work differently. Every answer depends on the prompt, the conversation so far, the model used and, where applicable, the web search.
Many GEO tools therefore ask a list of questions and count how often a brand appears. This has some value, but it mainly answers the question: “Does the AI know our brand?” For marketing and sales, however, we care about something else:
Is our specific product recommended when a potential customer is preparing a decision – and if not, which competitor is recommended instead?
From this we derive three analytical questions: How visible is our offer during the selection? Which characteristics get it recommended or passed over? And which sources does the assistant use for its answer?
An example from professional training: a provider may be recommended regularly for an SEO seminar, yet barely appear for an AI training course for teams. A single brand-level score would obscure this distinction. That is why we measure every product and service individually.
The starting point is the respective product page. From it we take the name, target group and benefit, as well as typical problems and expected gains (pains and gains). The page is read once; the stored version is kept for drafting prompts until someone deliberately updates it. AI suggestions are only adopted after human confirmation.
Instead of asking the assistant once for the “best providers”, we hold a multi-step conversation with it. We start openly, have it form a top 3 and then ask for a favourite. After that we change one criterion on purpose, such as price or practical relevance. Every answer stays in the conversation context – just like in a real dialogue. One unit of measurement is one conversation: prompt × assistant × repetition.
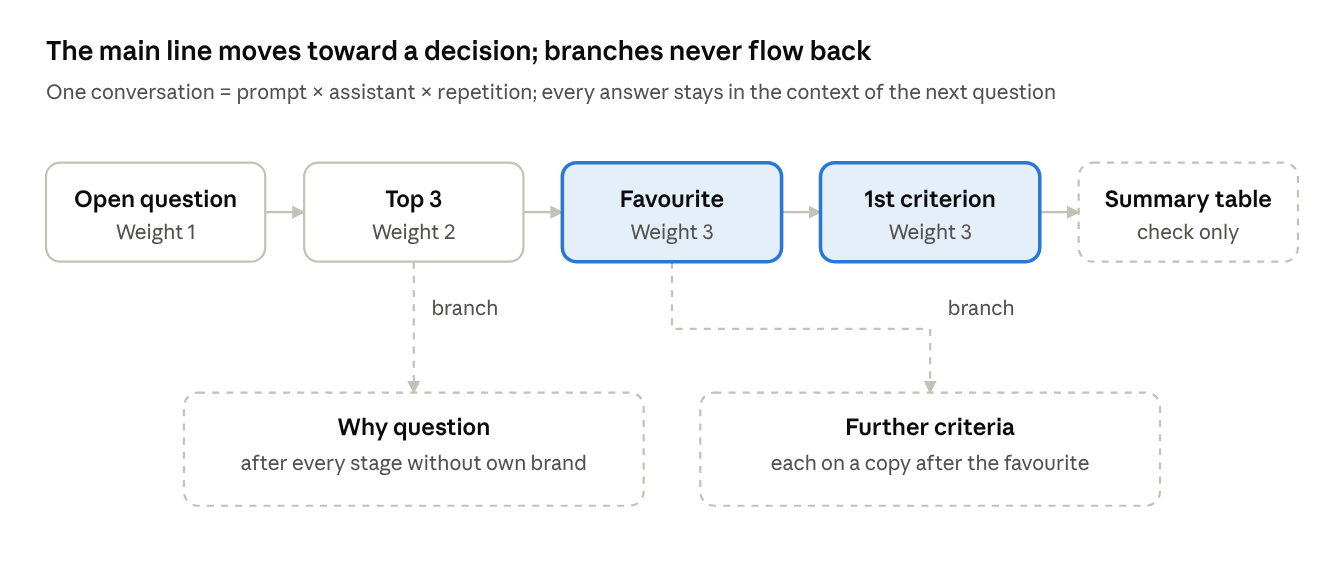
Fig. 1: Four stages that build on each other; follow-up questions run in separate conversation branches.
| Stage | Example question | Weight |
|---|---|---|
| Open question | “SEO training specifically for online shops?” | 1 |
| Top 3 | “Which three providers would you recommend?” | 2 |
| Favourite | “Which one would you choose?” | 3 |
| Favourite by criterion | “And if price matters most to me?” | 3 |
We deliberately keep two kinds of follow-up questions separate from the main conversation. First, we ask about additional criteria each time from the same conversation state. Otherwise the price question could distort the later quality answer. Second, if our brand is not mentioned, we ask why – but again only in a branch. If we introduced our brand directly into the main conversation, the follow-up question would influence the next recommendation, and in the end we would be measuring our own question.
At the end, we have the assistant summarise its conversation in a table. This self-report by the model is a control value for us. What counts are the answers we evaluate, not what the model claims about itself afterwards.
The reliability of our measurement depends heavily on the quality of the prompts. If we choose poor or very similar prompts, even the most precise index only measures the weaknesses of our questionnaire. That is why we don’t simply let the prompts be generated freely.
We use established marketing frameworks: the funnel (TOFU, MOFU, BOFU), AIDA, See-Think-Do-Care, the Messy Middle, as well as buying motives or pains and gains. Custom frameworks are possible too. Stages that don’t fit are deliberately excluded.
Every prompt must be phrased generically and aim at a provider recommendation. It may name neither our brand nor a competitor. A question like “What alternatives are there to provider X?” would be a different kind of measurement and does not belong in this panel.
With the prompts we pursue two goals that only seem to contradict each other: within a stage, the questions should be as different as possible – and yet all fit that very stage as well as possible. We want to capture different paths to the same buying intent, not ask the same question six times.
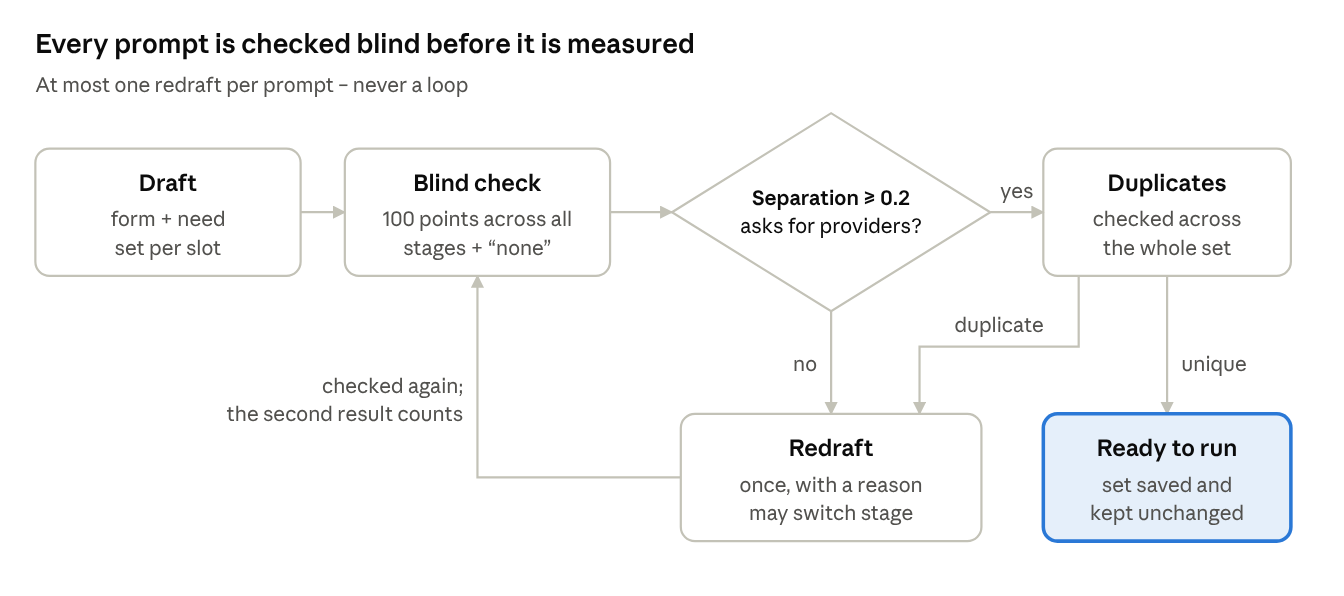
Fig. 2: Draft, blind check, at most one redraft and a duplicate check before measuring.
The basic problem of every GEO measurement: for a topic like “SEO seminar” there are not ten questions but millions of different conversations. People choose different words, bring different prior knowledge, describe different situations and ask follow-ups differently. No measurement can hold all these conversations, and nobody knows their actual distribution.
So we proceed as in empirical research: we draw a sample. It consists of prompts on the same topic that are as independent of each other as possible – different motives, question forms and needs, no two variants of the same question. Independent here means: the prompts share the topic but not the wording. The next two sections describe how we ensure this.
This leads us to a key principle:
The principle is familiar from survey research: if ten very different people independently say the same thing, it is likely that others share this view. If everyone says something different, there is no settled majority opinion.
To separate wording from chance, we combine two comparisons: the agreement between repetitions of the same prompt and the agreement between different prompts for the same product (calculation in the section on stability further down).
| Repetitions of a prompt | Different prompts | Reading |
|---|---|---|
| agree | agree | Robust recommendation: probably also holds for many unmeasured variants. |
| agree | differ | The wording decides: each question has its own stable answer. The result only applies to questions of this kind. |
| differ | differ | No settled “opinion”: chance dominates. More repetitions help, or the market is still open in AI. |
It is important to put this in context: our prompt sets resemble a quota sample. We stratify by buying stages or motives and fill each stratum with questions that are as different as possible. Within the strata, however, we do not draw at random from real conversations, and nobody knows how large each stratum is in reality. The inference to unmeasured prompts is therefore a plausibility argument, not a statistical proof. How far it carries depends on how different the prompts really are – which is exactly why we check variety and duplicates so strictly. We deliberately haven’t set a fixed threshold above which a set counts as meaningful yet; we read the agreement as a continuum.
When drafting, every slot in a stage is given a question form and a need that fits the motive. A second model then assigns the prompts blind to all stages of the framework – including the category “none”. The intended stage is not revealed. For each prompt it distributes points according to how strongly the individual buying motives come through.
From this we calculate two indicators:

Here, a is a stage’s share of the points. Fit shows how clearly a prompt expresses its motive. Separation shows how clearly it stands apart from the strongest neighbouring motive. If it is too low, the prompt measures the neighbouring motive just as well.
If a prompt falls below our minimum or does not aim at a concrete provider recommendation, we redraft it once with targeted feedback. This second check result is documented as well – so we don’t optimise endlessly for a test score. If a prompt fits another stage better, it is moved there.
What we observed: for 192 motive prompts for 121WATT seminars, the intended stage received the highest score in 96% of cases. On average, however, only about two thirds of the points went to the prompt’s own stage. So the questions can mostly be assigned well, but often contain aspects of neighbouring motives.
Content duplicates. A checking model groups, across the whole question set, the prompts that ask for the same thing – even if they look different linguistically. From each group we keep the prompt with the better stage fit; the others are redrafted.
Formal variety. Each question gets a form signature made of sentence form, context and comparison mode. For each stage we count the distinct questions and the distinct form signatures. Ideally, both equal the number of prompts used.
Why we set forms and needs as early as the draft: without a prescribed form, 73% of motive prompts followed practically the same pattern (“I’m looking for …, can anyone recommend something?”). The needs must fit the stage’s motive. Otherwise a need from another motive pulls the prompt towards that motive.
We also tested embedding similarity. It proved unsuitable: it mainly detects the shared product vocabulary, not the buying motive. That is why we check fit and duplicates through a model’s judgement of the content.
Interim conclusion: good prompts are close in content to their stage, but as little redundant among themselves as possible. These checks improve our constructed panel; they do not guarantee a representative picture of real user questions. And once a prompt set has been measured, we don’t change it quietly: new prompts are a new sample, and that break is marked in the time series.
For every product and every prompt, 121suite holds separate conversations with ChatGPT, Gemini, Claude and Perplexity via their APIs – each with web search.
Language and market are decisive. Anyone analysing the Spanish market must ask in Spanish and measure in Spanish web search – regardless of whether the user interface is in German. Without a location setting, some providers search from the US; with one, the share of local sources rises noticeably. Not every interface offers this control, so the assistants are not fully comparable.
Repetition instead of false precision. The answers of generative models fluctuate. That is why we repeat every conversation several times. This shows whether a provider is named regularly or only turns up by chance. Measurements run manually or monthly. Interrupted individual conversations are re-run with the same model so that two points in time don’t get mixed.
The model is part of the measurement conditions. By default we use the most capable model of each provider whose web search we have tested. If it is replaced, we document the model change in the time series. After all, a different model is a different measuring instrument.
A mere mention is not the same as a recommendation. That is why a separate evaluation model analyses every answer, extracts all providers named and assigns each mention a role. We also match our own brand against the raw text, so that a missed extraction doesn’t simply get lost.
| Role | Meaning |
|---|---|
| Recommendation | The assistant explicitly advises in favour of a provider. |
| Neutral | The provider is mentioned but not assessed. |
| Critical | The provider is mentioned with a warning or caveat. |
| Source only | Our own website is cited, but our brand does not appear in the answer at all: the content is read, the offer is not recommended. |
If several roles occur for the same provider in one answer, the critical mention takes precedence over a recommendation and a neutral mention. A warning should not disappear into a positive average.
There is also a practical problem: one assistant writes “Haufe”, another “Haufe Akademie”. The application suggests possible merges, but a human has to decide. The raw answer stays unchanged; assignments can be undone at any time.
First, for each conversation stage we calculate the share of answers in which a provider appears. From this we form a weighted average between 0 and 100. The open question has weight 1, the top 3 weight 2, and both favourite stages weight 3 each. Later stages weigh more because they come closer to a concrete decision.
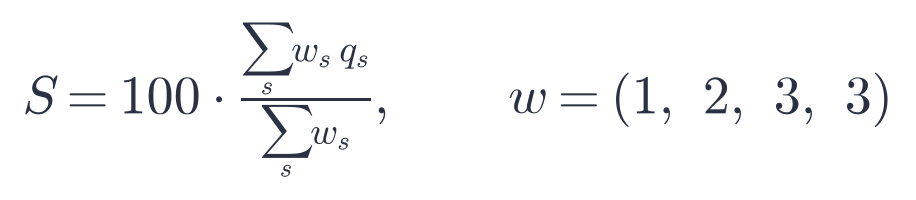
Stages without answers drop out of the denominator and are not mistakenly counted as zero. Across several products, every product counts equally: we aggregate per product first and then take the average. Otherwise products with many prompts would distort the overall picture. A product without a measurement appears as “not measured”, never as 0%.
One conceptual clarification matters to us here: the index is a weighted indicator of recommendations and mentions. It is not a probability that a real buyer will receive a particular recommendation. Its sensible use lies in structured comparisons – with competitors, between assistants and over time. We describe when a lead is robust in the section on the reliability of the measurement.
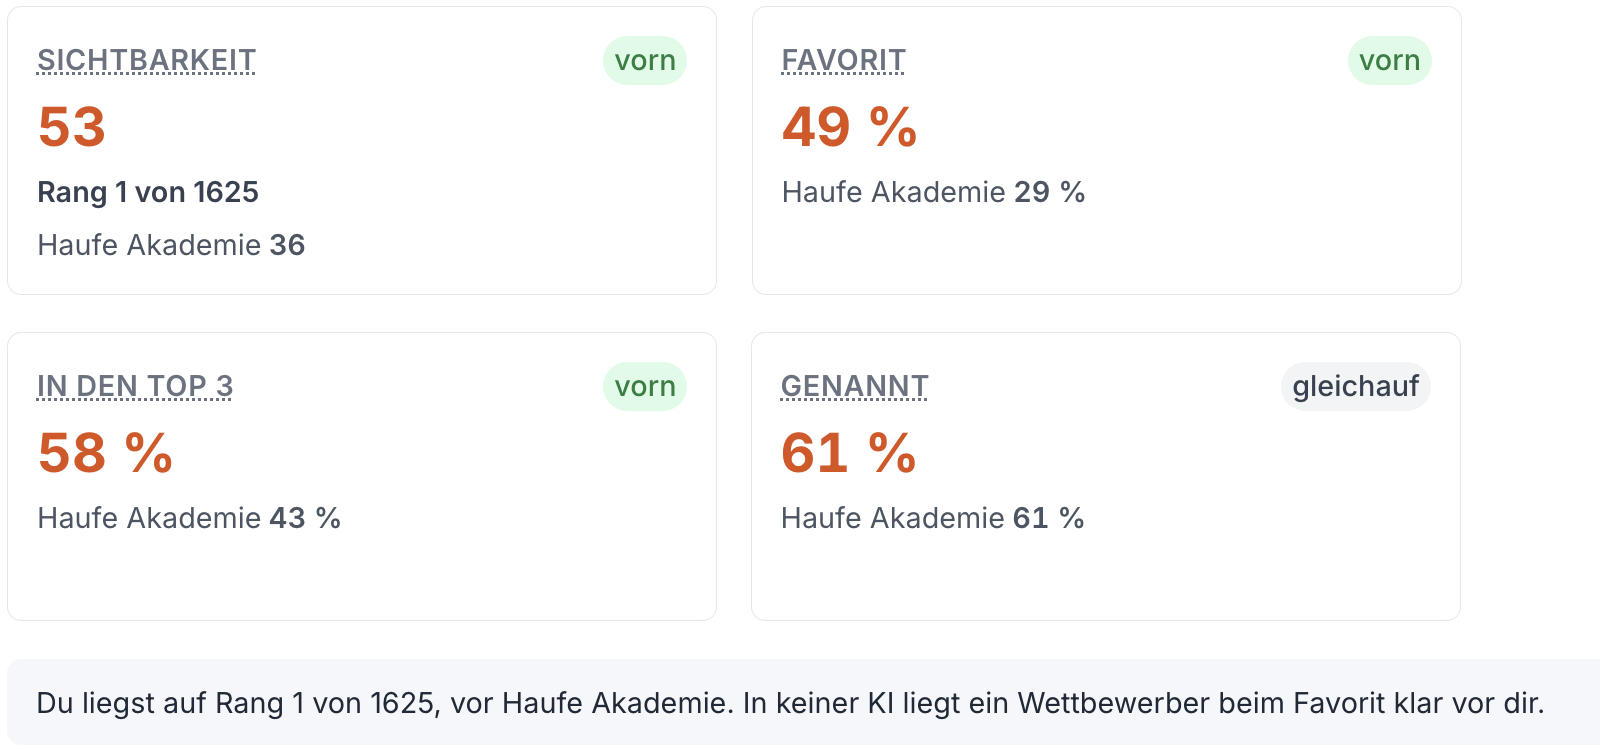

Fig. 3: Excerpt from a 121suite test run – visibility. Overview of visibility, favourite, top 3 and mentions compared with the strongest competitor, followed by the ranking of providers (based on 787 conversations). Screenshots from the German interface.
We look at two questions separately. Reliability: do we get similar answers under similar conditions? Validity: are we measuring the behaviour we are interested in at all?
Every rate is a share p out of n answers. As a simple approximation we use the binomial standard error:
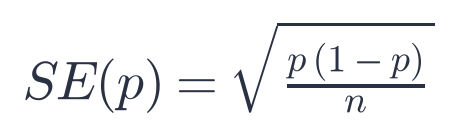
For the visibility index we combine the standard errors of the stages according to their weights, treating the stages as independent. When comparing with a competitor, we test the difference d two-sided at the 95% level:

Only then does the analysis show “ahead” or “behind”, otherwise “level”. An example: with 300 answers and a favourite rate of 43% versus 45%, the threshold is around 7.9 percentage points – a difference of two points is “level”. Important: for us, “level” explicitly means “no statistically detectable difference”, not that two providers are really equally strong. The same rule applies to each AI individually, per product and per criterion.
This appears to be a clear threshold, but it requires an important caveat: the calculation treats answers as independent. In fact we repeat the same prompts, and the stages of a buying conversation build on each other. 30 similar answers are not automatically 30 independent observations. The calculated standard error may therefore be too small, and a reported lead may look more certain than it is. For now, the 95% threshold is a guide under simplifying assumptions, not proof.
A sensible next step is a bootstrap at prompt level: whole prompts, including all repetitions and conversation stages, are resampled instead of treating individual answers as independent. This allows a more robust estimate of the uncertainty for the index and for differences. It does not, however, solve the question of how representative synthetic questions are of real buying conversations.
If an assistant names the same provider ten times for ten almost identical questions, that is at first only a stable answer to a very similar question. But if it recommends that provider across different, stage-consistent questions and repeated conversations, the recommendation evidently depends less on any single wording.
For top-3 lists we measure agreement with the Jaccard coefficient: shared providers divided by all providers named. {A, B, C} and {A, B, D} give 2/4 = 0.5; identical lists give 1. We calculate it separately:
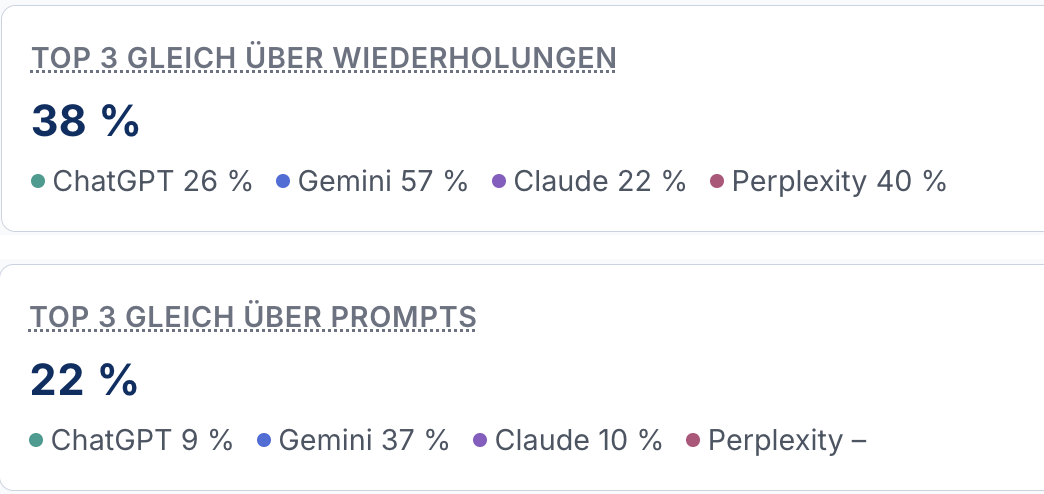
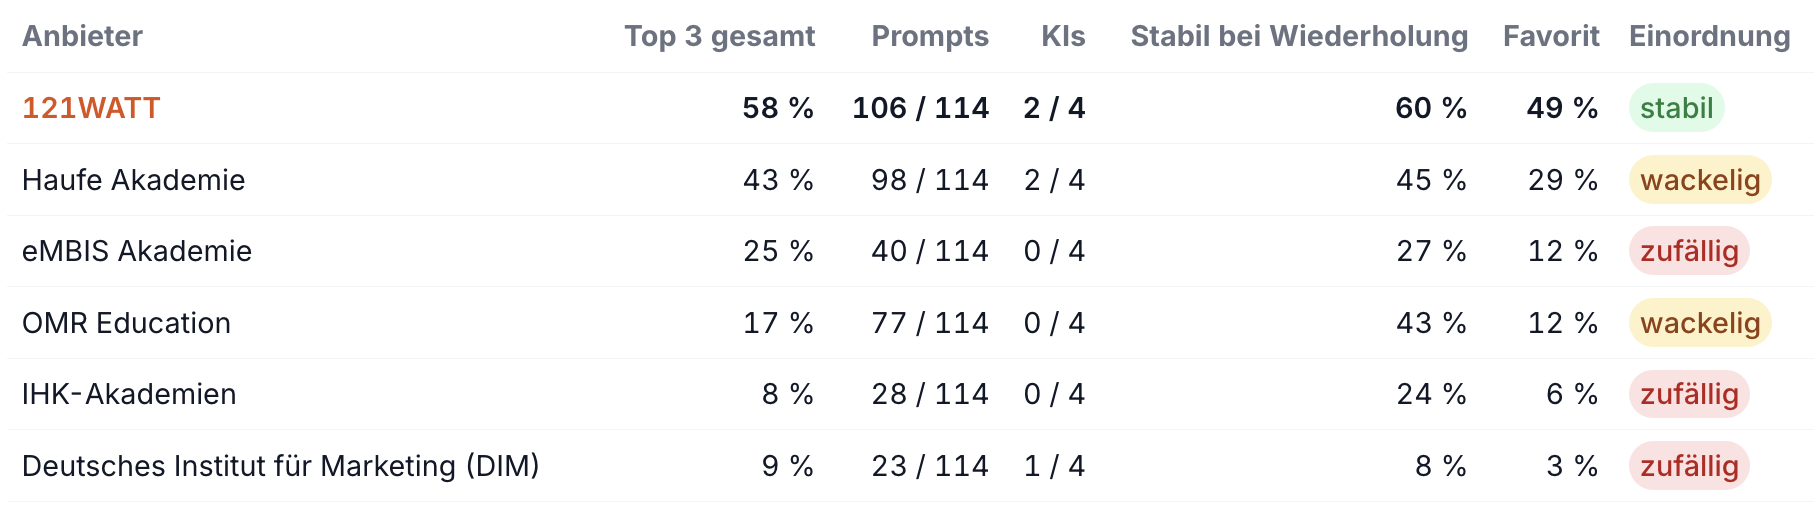
Fig. 4: Excerpt from a 121suite test run – stability of results. Agreement of the top 3 across repetitions and across prompts, per assistant, followed by the classification per provider. Screenshots from the German interface (“stabil” = stable, “wackelig” = shaky, “zufällig” = random).
In the example, the top 3 agree 38% of the time across repetitions, but only 22% across different prompts. Prompt wording therefore has a substantial impact on the results. Even so, the leading provider is in the top 3 for 106 of 114 prompts – exactly the kind of recommendation that, in line with the key principle above, indicates robustness to variations in wording.
Our central hypothesis: the more different the questions within a buying motive and the more consistent the recommendations, the more robust the statement about which provider an AI prefers under the tested conditions. Analysing agreement per framework stage is the obvious next step.
This allows a well-founded statement about recommendation stability within the panel examined. It does not allow a statement like “Every real user has an 85% probability of being recommended this provider”. For that we would need to know how real users distribute their questions and which contexts they bring with them.
Our interim conclusion: stage fit, variety, repetitions and stability analyses make the measurement more transparent and more robust. We still show the statistical uncertainty explicitly – rather than turning a synthetic panel into certainty about the behaviour of all buyers.
The visibility index tells you whether an assistant recommends you. It does not tell you whether that creates business. For that, we rely on an instrument we have used for years: customers’ self-reports right after the purchase.
Why not via click data? An AI recommendation leaves hardly any trace of its own in web analytics. Someone who reads about a provider in ChatGPT later googles it or types in the address directly. In web analytics this shows up as a brand search, an ad click or direct traffic – exactly the channels that already bundle many other causes. We showed this back in 2019: in our article on measuring word-of-mouth and cross-channel effects (in German), 74% of the seminar registrations that web analytics counted as “direct” were, according to customers, due to existing customers and recommendations. Even for registrations via paid Google ads, only 41% named Google as the actual trigger. Web analytics shows where someone comes from, not why.
How we ask. We apply this approach to GEO:
How we link it to the index. We track the share “AI assistant” month by month, per product where possible, and set it next to the visibility index from the same month. If both rise together, that is a hint, not proof of causality. Anyone who evaluates a measure after a few days measures fluctuations rather than effects; the monthly cycle therefore suits both measurements.
Limits of self-reports. They only capture conscious, remembered influences. When purchase volumes are low, the sample size may be insufficient. And people like to answer in a way that sounds smart – which is exactly Rand Fishkin’s main objection to surveys – so “ChatGPT” may be over- or under-reported in surveys. Randomised order, the dummy option and the open answers help to detect such effects. That is why we mainly evaluate how the share develops over the months, not its absolute level. Even so, self-reports are currently the most direct way to see the business effect of an AI recommendation at all.
GEO visibility is not a fixed Google position. It changes with the question, the course of the conversation and the model. For a sensible measurement we therefore need not one prompt and a brand count, but a transparent sample, standardised conversation stages, repetitions and clear evaluation rules.
Our most important decisions were:
This makes it much easier to see where offers stand in an AI-supported selection process and which measures might pay off. However, these measurements should not be interpreted as definitive evidence of real-world user behaviour, and they are no substitute for business figures. Whether GEO is a distraction is ultimately decided not by traffic, but by customers’ answer to the question of what brought them to us.
We welcome your perspective: how do you measure recommendations in AI assistants? And where do you see the biggest methodological limits? We look forward to your experiences.
About 121suite and 121 Apps GmbH
121suite.com (currently in closed beta) is a marketing platform that brings SEO, paid and GEO data together in one application. At its core is the measurement described here of how visible products and services are in ChatGPT, Gemini, Claude and Perplexity: simulated buying conversations, checked prompts, source and competitor analysis, each in the language and with the web search of the target market.
We develop 121suite at 121 Apps GmbH, together with other products on topics that keep us busy:
- 121surveys.com – online surveys (launched)
- paperball.finance – ETF backtests, Monte Carlo simulations and securities watchlists (launched), part of the paperball.de product family
- 121suite.com – marketing platform with GEO visibility measurement (currently in closed beta)
- 121assist.com – AI-powered RAG chat systems for customer support and knowledge transfer (currently in closed beta)
More about us and all products: 121apps.com
Deine Stimme entscheidet mit, welche Themen wir als Nächstes vertiefen.
Optional, aber Gold wert für unsere Redaktion.
Danke, du hast dieser Artikel bereits bewertet.

 089 416126990
